Isochrone generation
Drive, bike and walk zones from 5 to 60 minutes where routing coverage is available.
Explore the generatorHorizon Mapper draws yours: free isochrone maps for drive, bike and walk with population and accessibility built in — and Decision Packs (coming soon) when the catchment must convince a client, a committee, or a board.
Nothing below is a mockup. These are actual screenshots from the app — from a single drive-time zone to live weather, the planet's open signals and the layers beneath a city. The globe follows along.
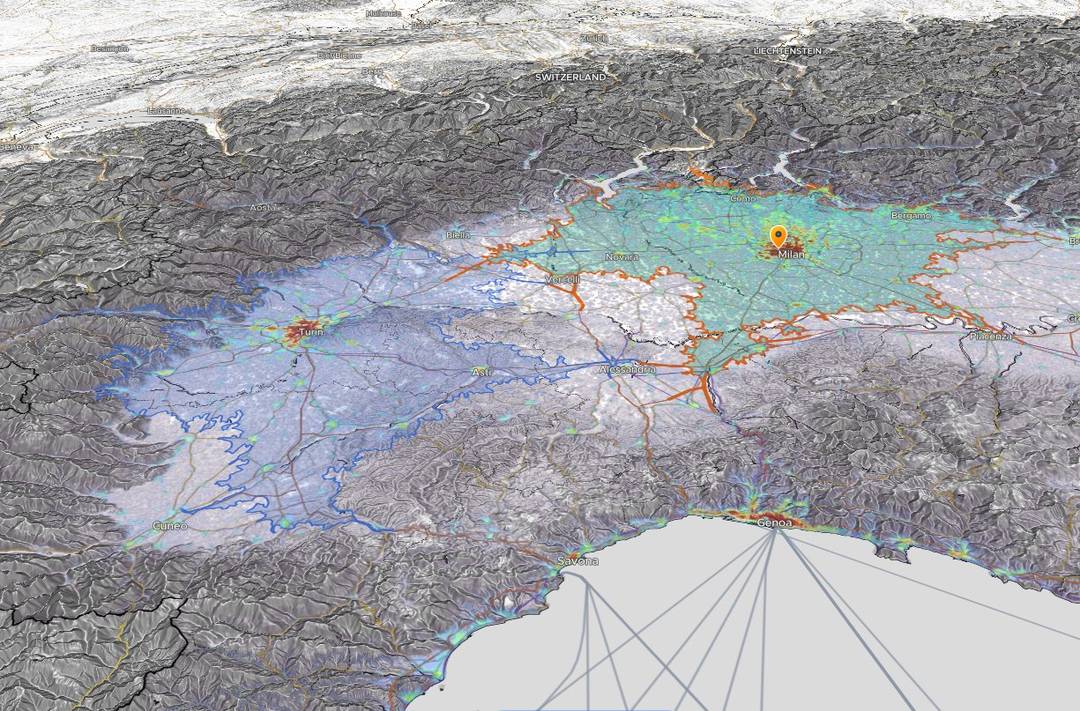
Two 60-minute drive zones compared across the Alps — boundaries bent by mountains and motorways, population glowing inside each line.
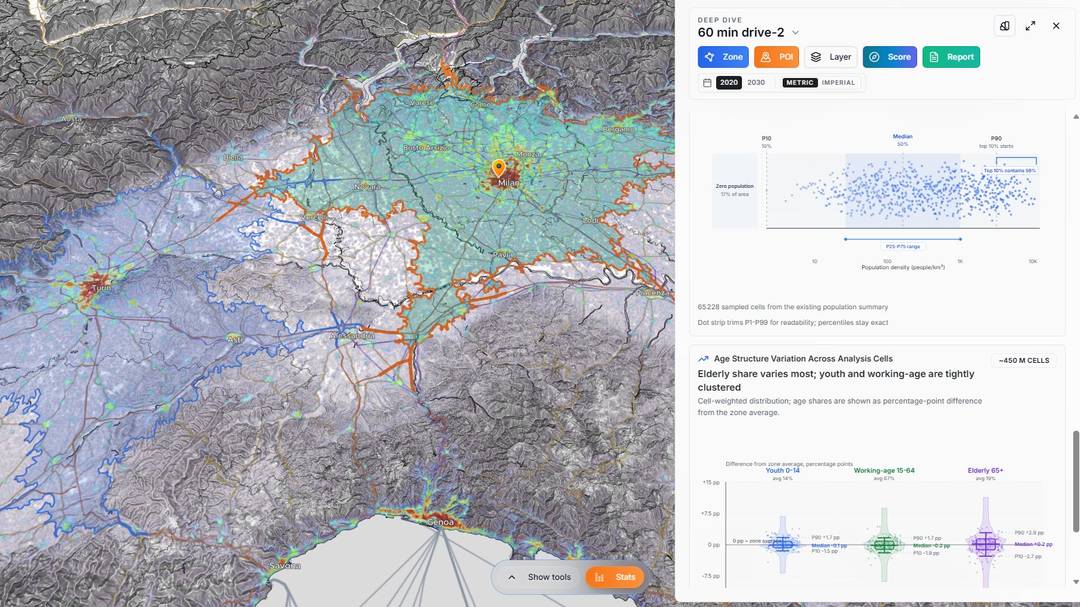
Density distribution across 65,228 sampled cells with exact percentiles, plus age-structure variation — Zone, POI, Layer, Score and Report, one click apart.
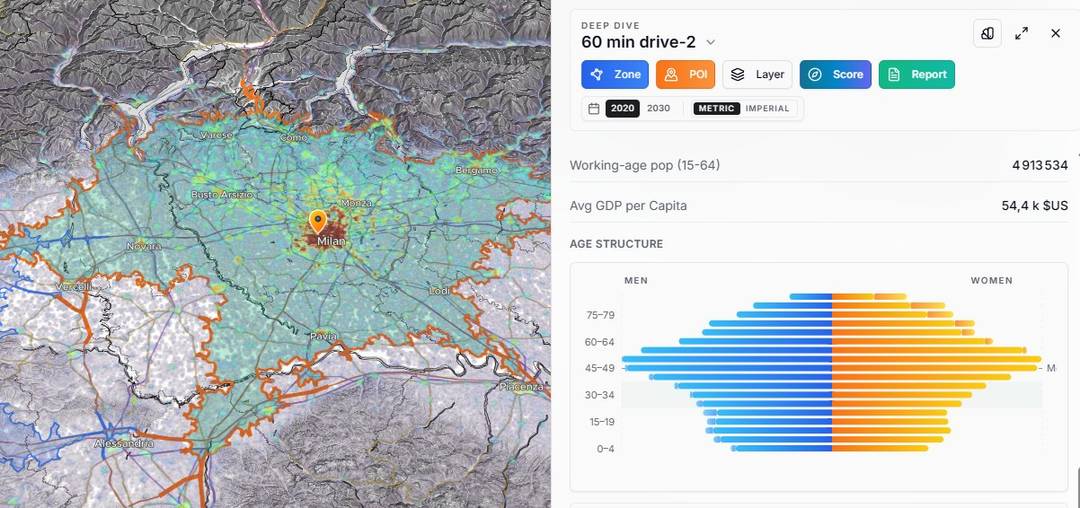
4,913,534 working-age people, GDP per capita and a full age pyramid for one drive-time zone — with 2020 and 2030 side by side.
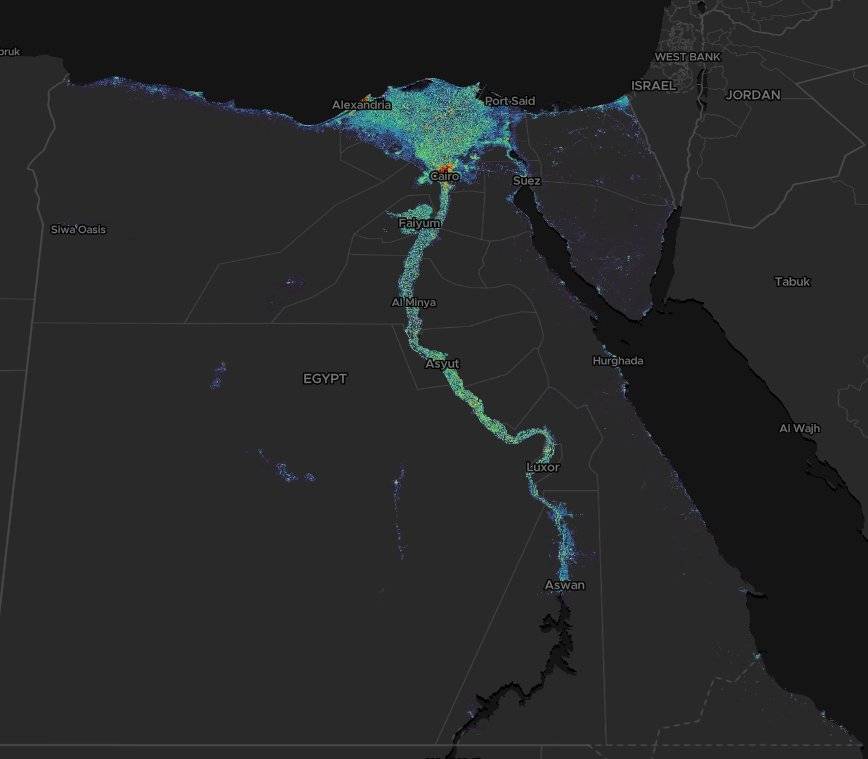
Population rasters at any scale — Egypt's story told by the Nile alone, on the dark basemap.
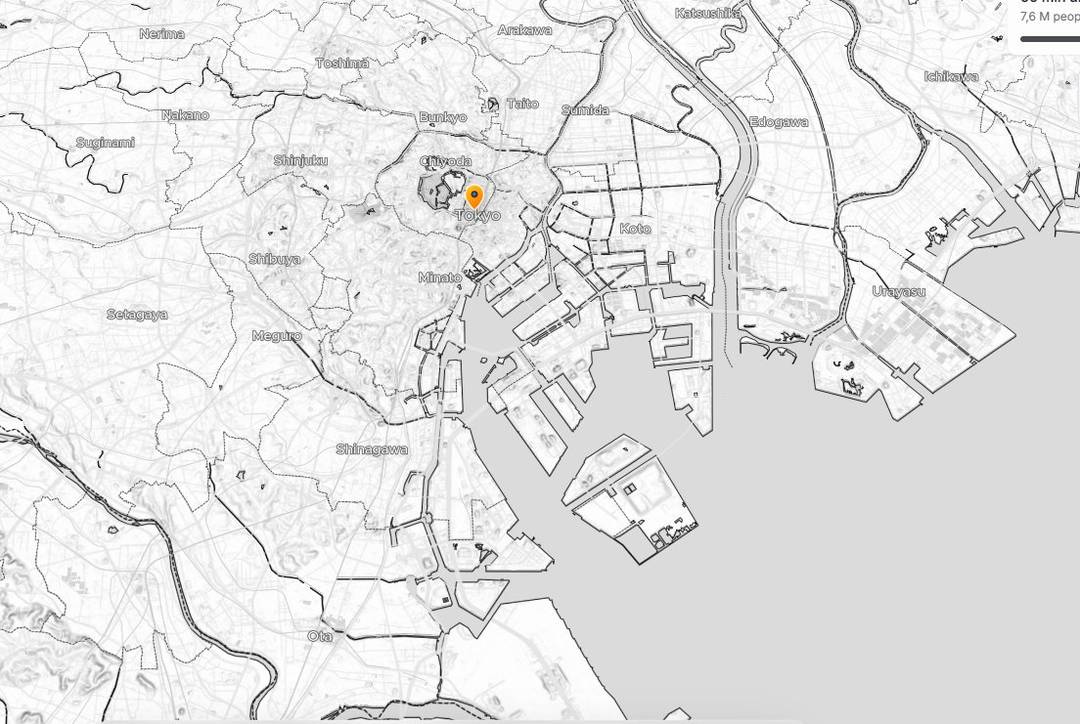
A clean grayscale basemap when the zone — and its 7.6M people — should do all the talking.
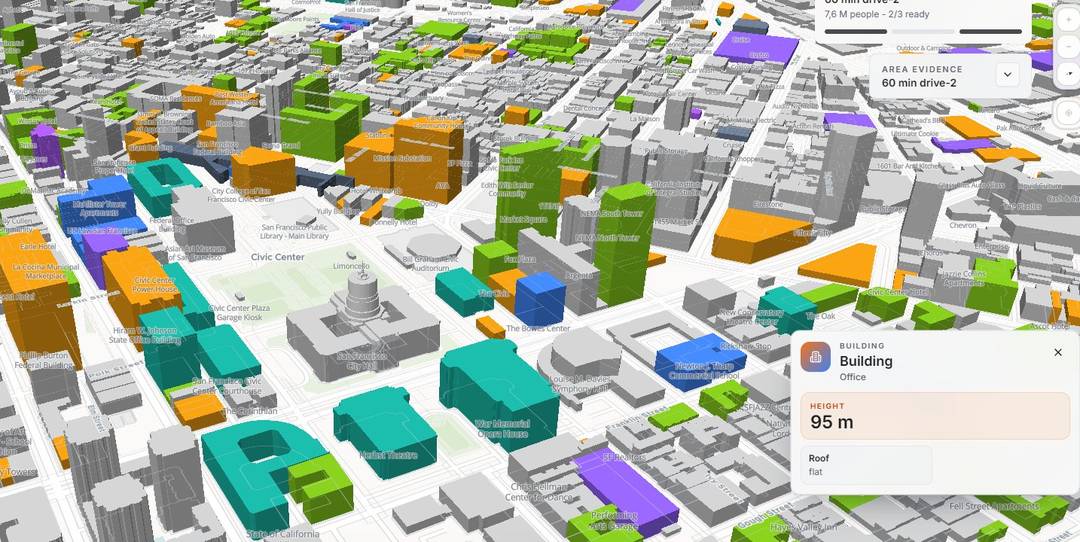
Inside a zone, inspect 3D buildings by use — offices, hotels, retail — down to a 95 m tower and its roof type.
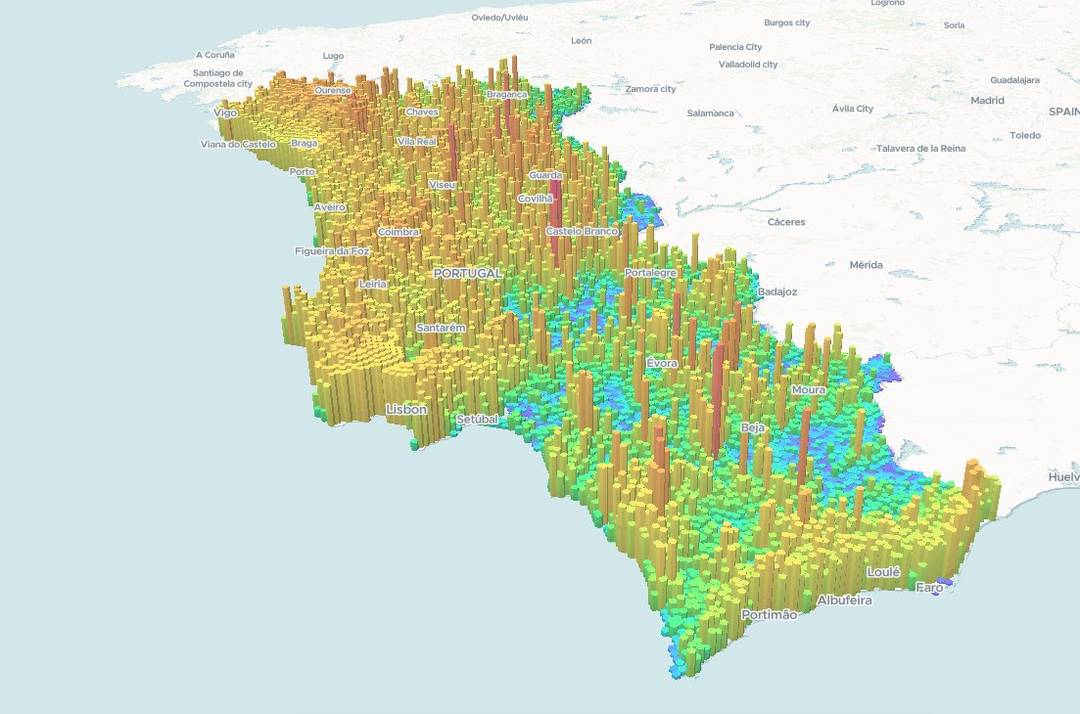
Pick a POI category and the map surfaces where the leads are — scoring and ranking the strongest locations across the zone.
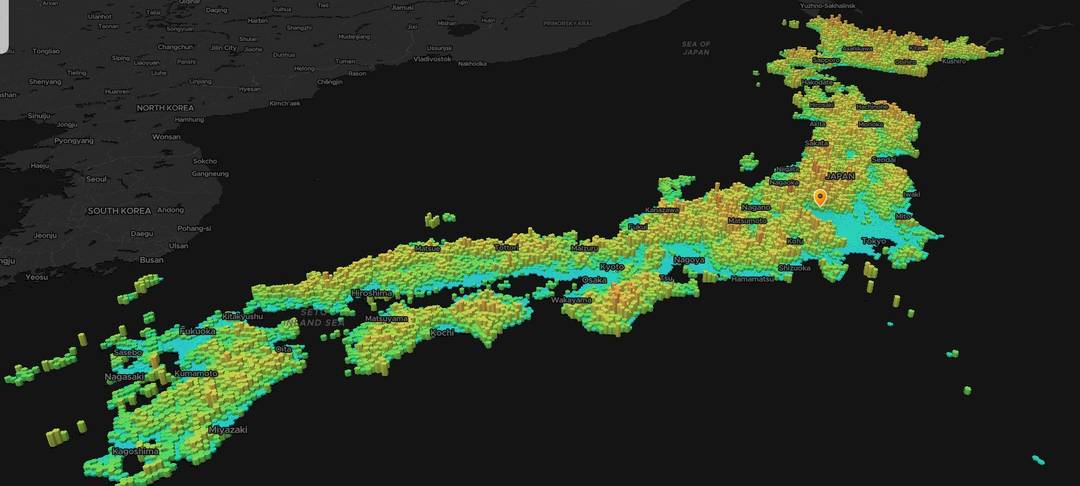
From one neighbourhood to an archipelago — pin, zone, layers, evidence. The workflow never changes.
Now the map reads the live planet
The same globe, the same workflow — turned outward to real-time weather, open intelligence feeds and the make-up of any place on Earth.
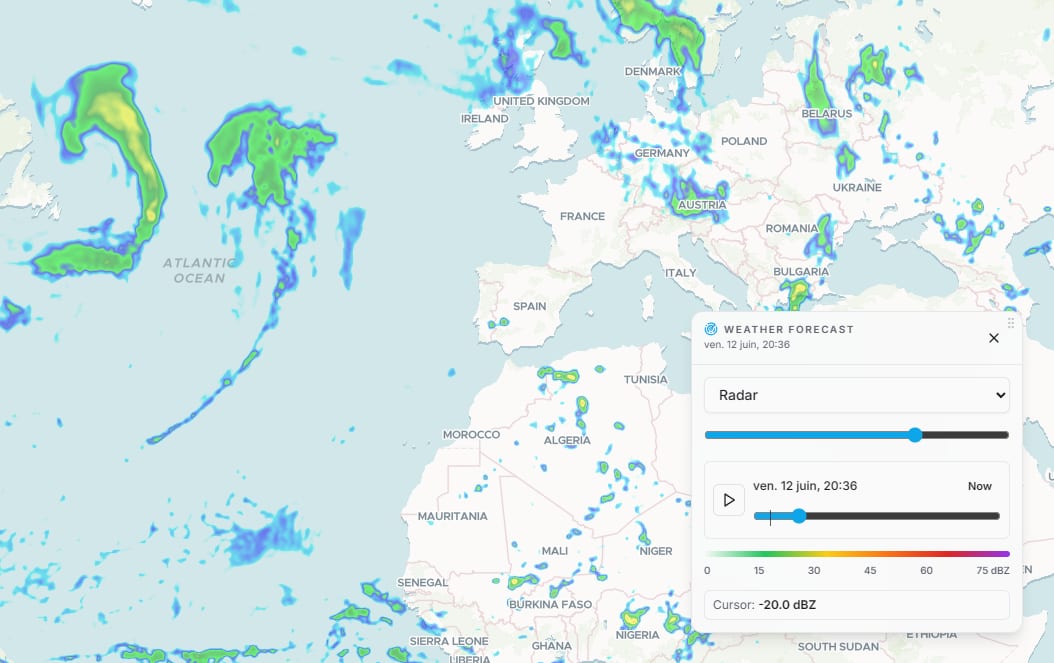 Radar
Radar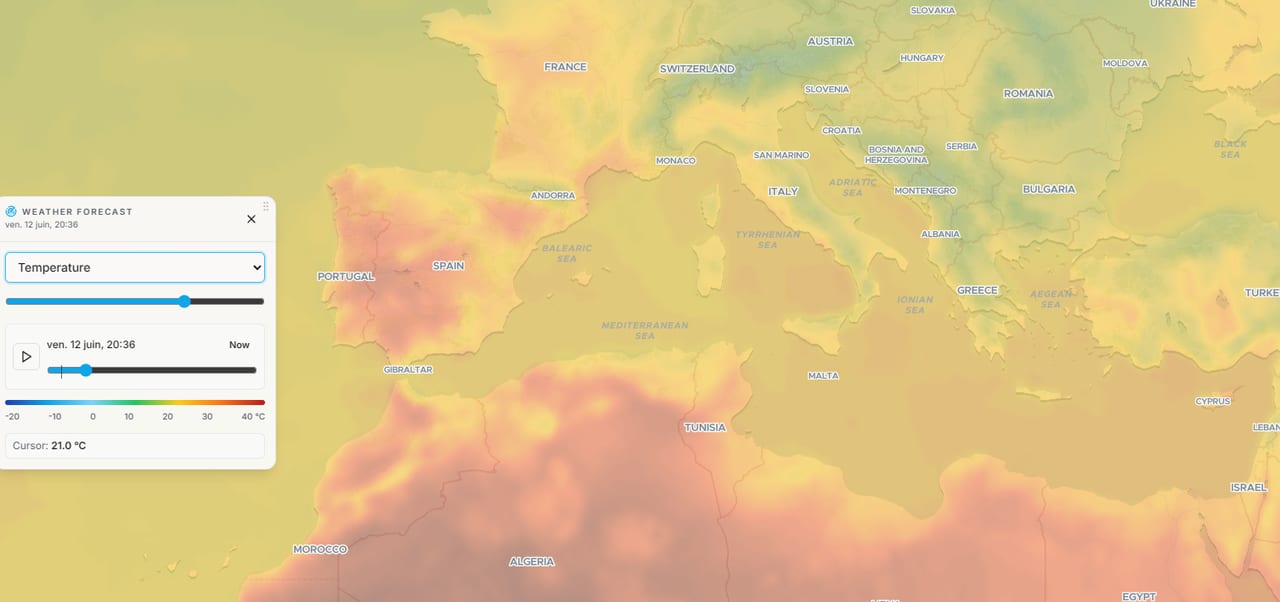 Temperature
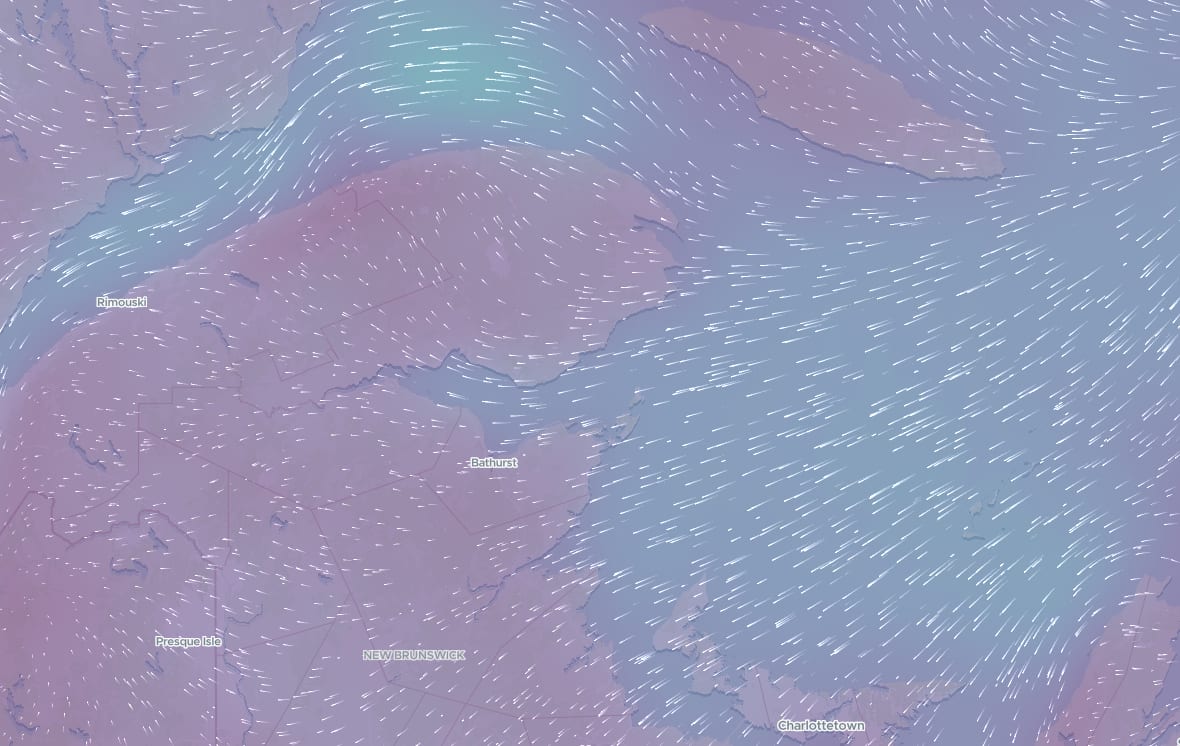 Wind
WindRadar, temperature, wind, rain and pressure — read the sky right now or scrub a forecast across the coming days on a timeline you can play.
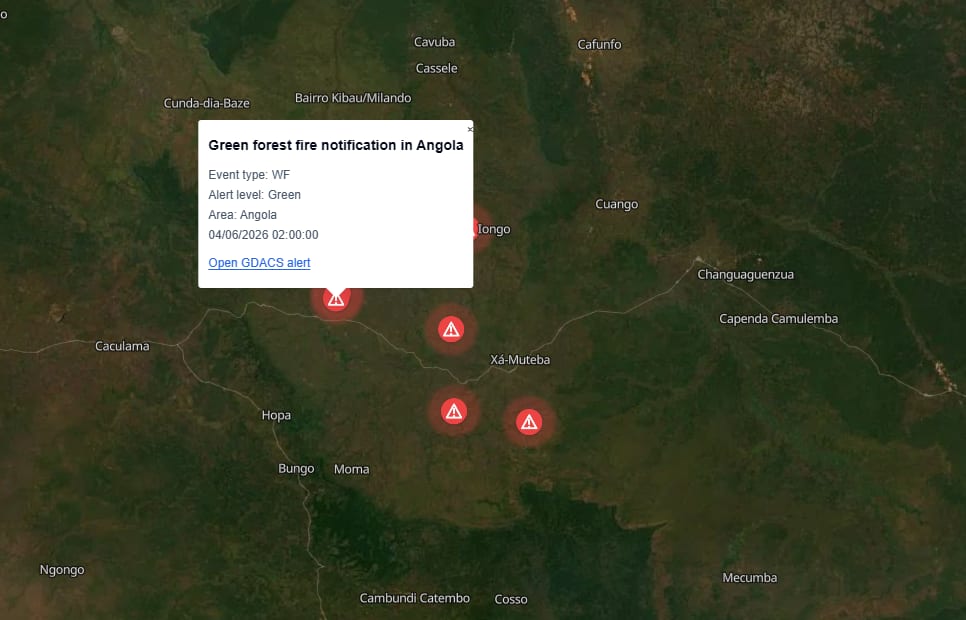 Global disaster alerts · GDACS
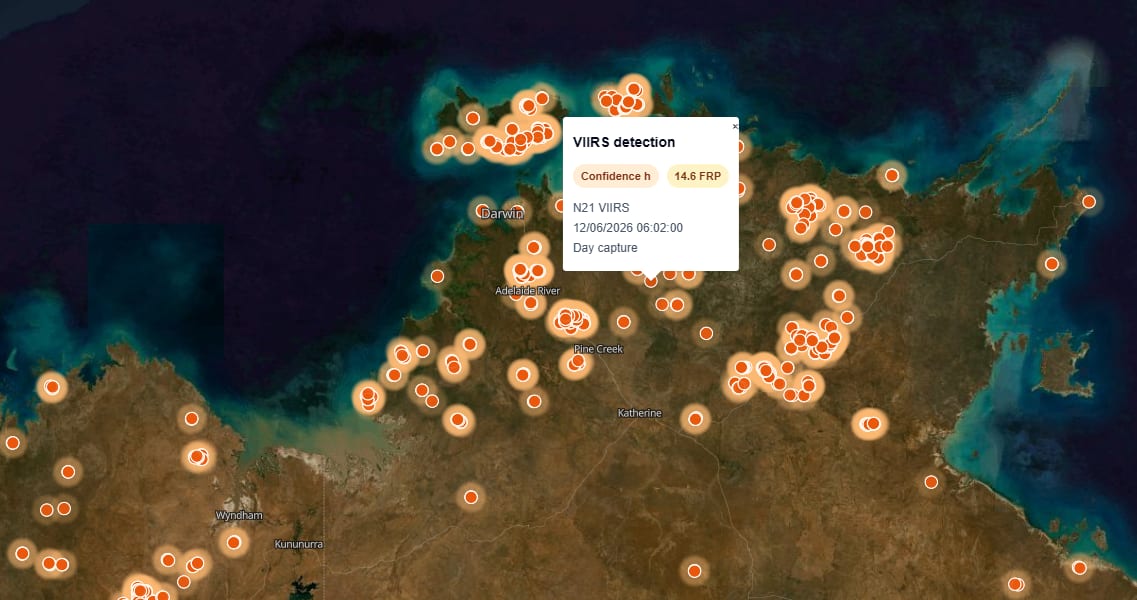 Thermal detections · NASA FIRMS
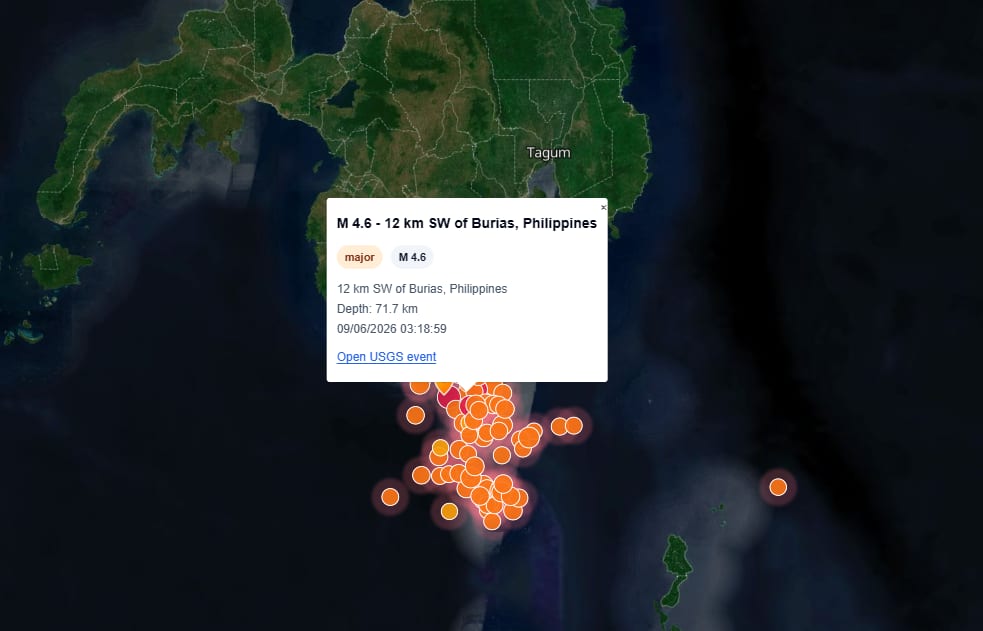 Seismic activity · USGS
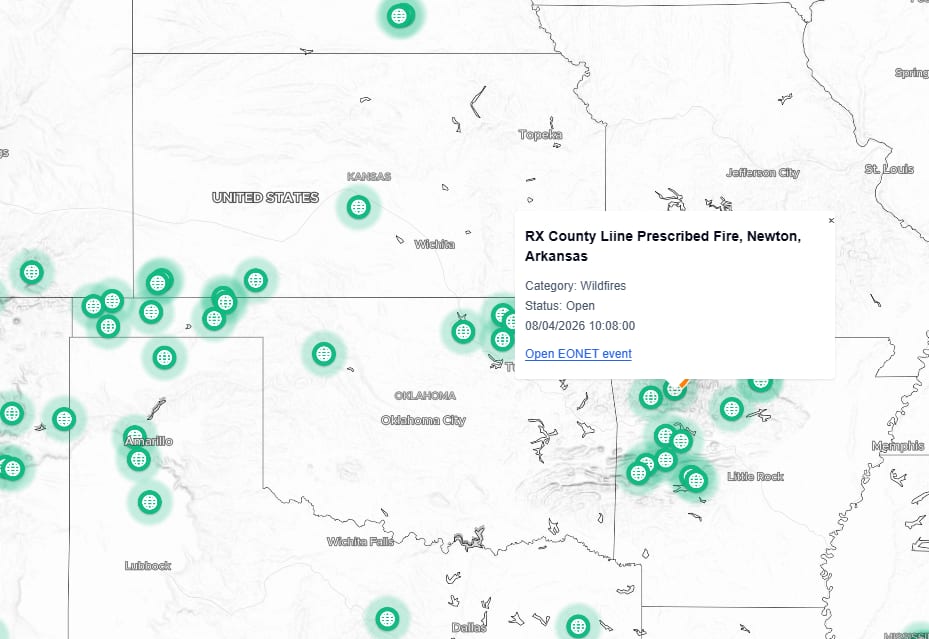 Natural events · NASA EONET
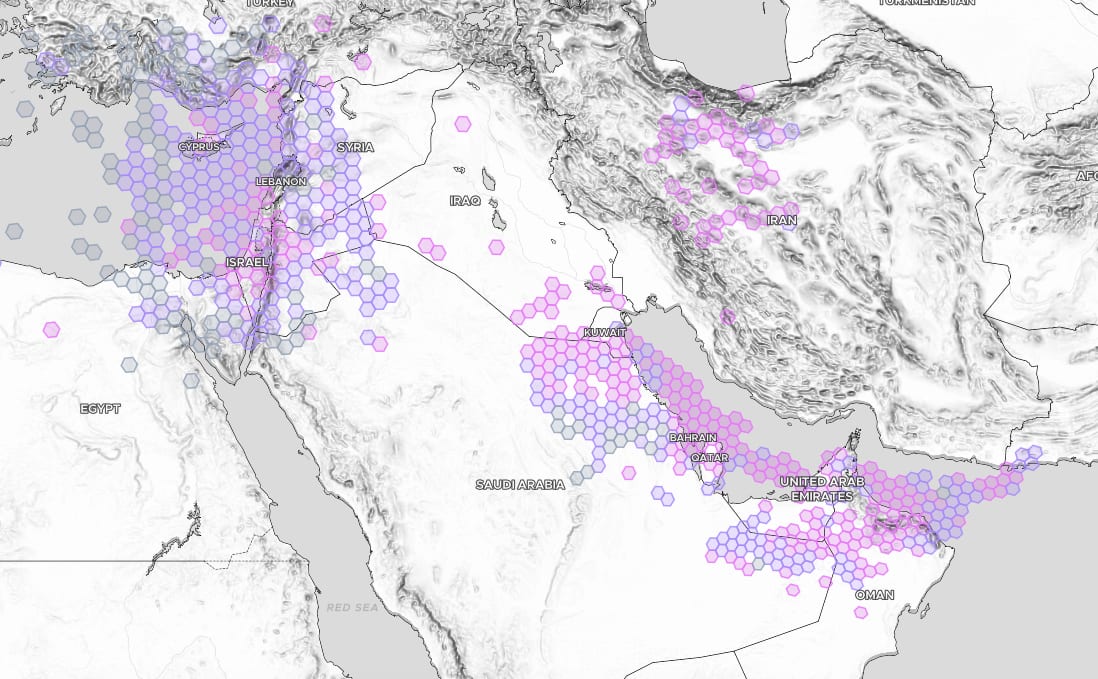 GPS jamming
Global disaster alerts, NASA natural events, GPS jamming, thermal fire detections and seismic activity — open intelligence feeds streamed straight onto the map, click any marker for the source.
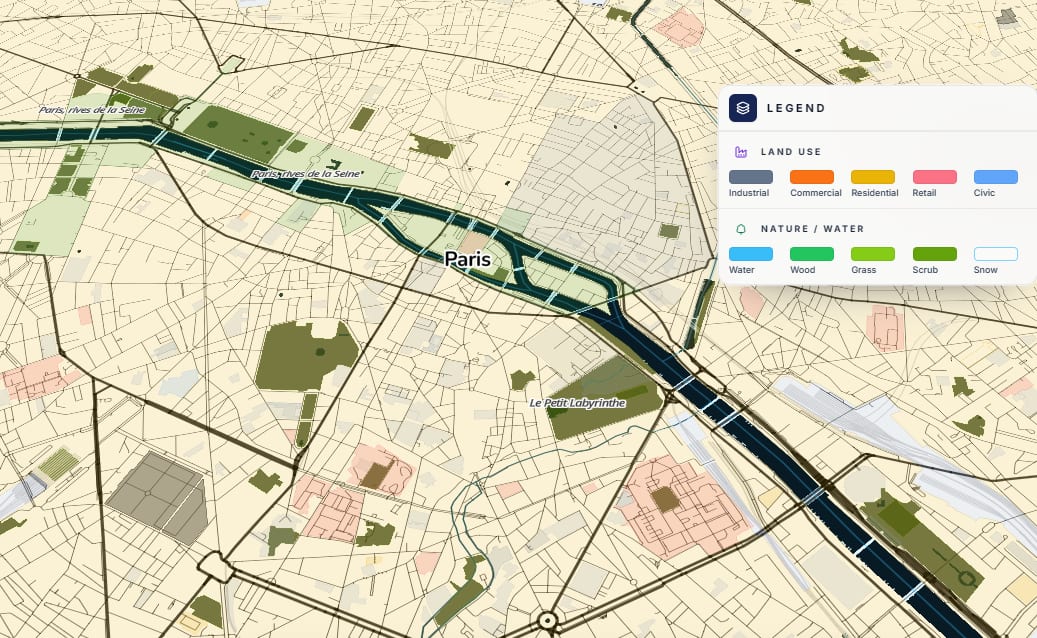
Switch between basemap styles, then layer nature, water, land use and transport over an area — the legend tells you exactly what every colour means.
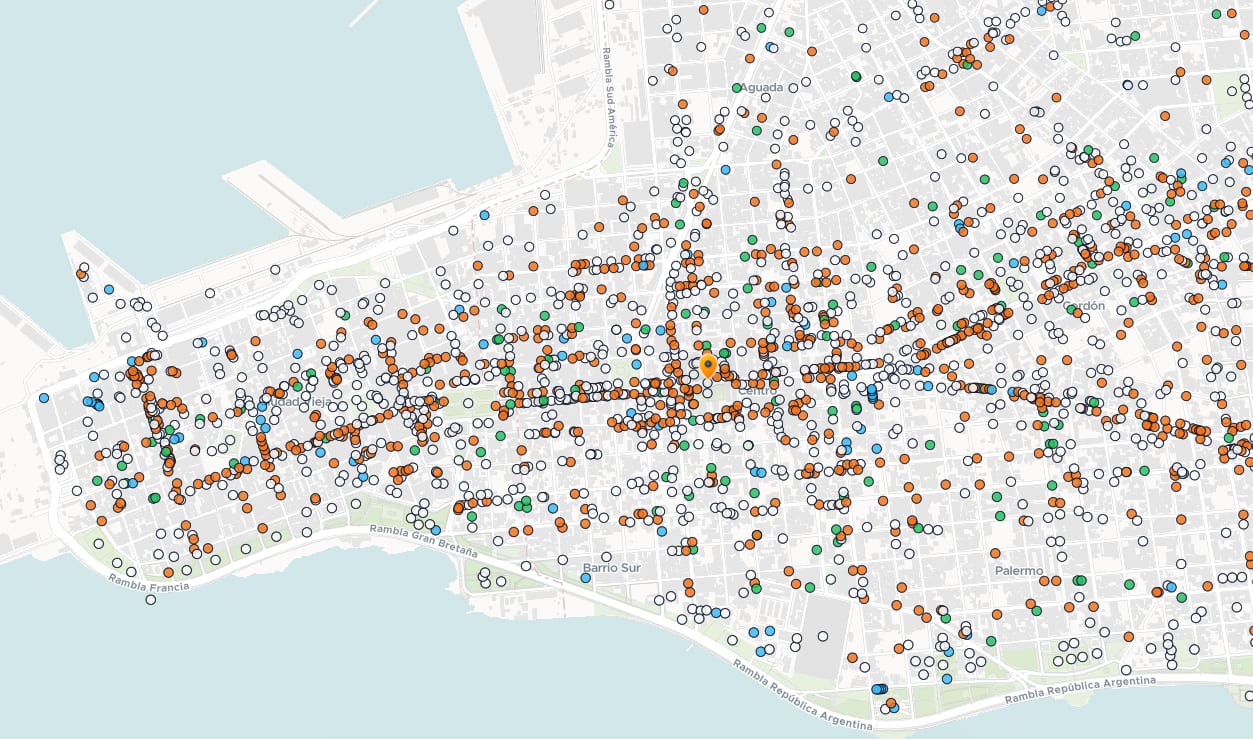
Thousands of Overture points of interest across a zone — colour-coded by category, from shops and schools to services, all the way down the street.
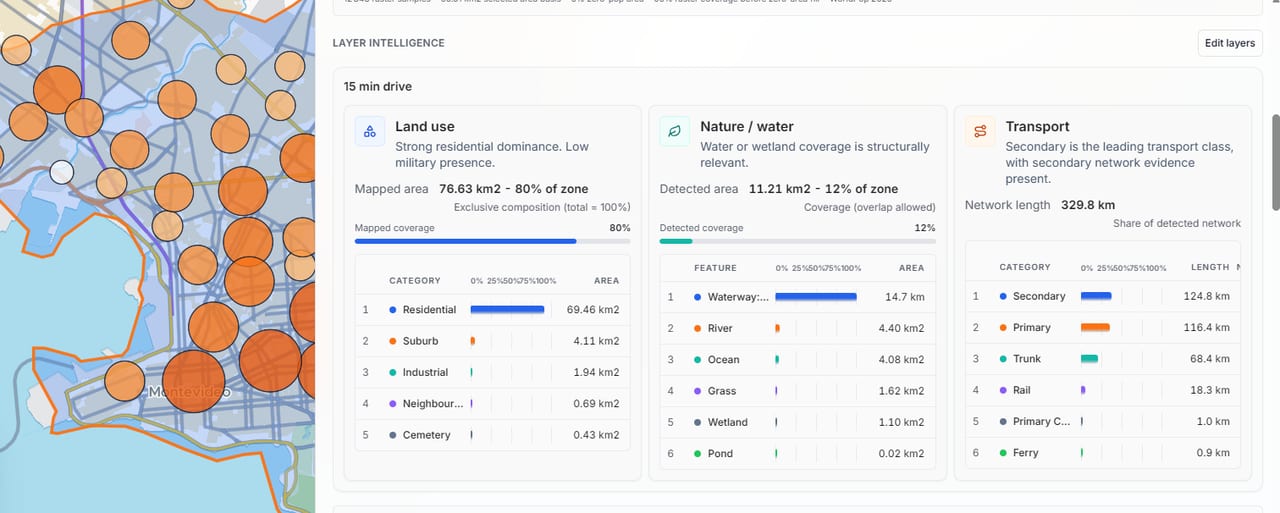
Those nature, water, land-use and transport layers become plain readings — residential dominance, water coverage and total network length, broken down per zone.
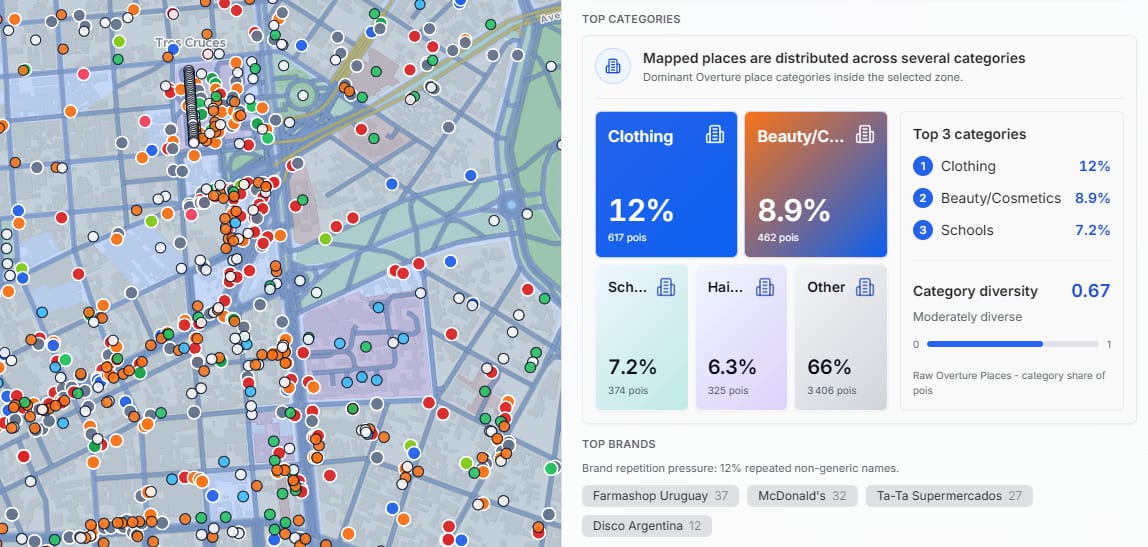
A treemap of every mapped place by category, the top brands and a diversity score — the character of a neighbourhood, at a glance.
Review the routing method, data sources and uncertainty, then use the practical score guide to turn a colorful result into a decision you can defend.
Start with reach, travel mode, and the population inside the line.
Compare demand, supply pressure, access friction, and confidence.
Understand typical speeds, data coverage, edge effects, and when local validation matters.
One coherent toolkit for travel-time, population and accessibility analysis — generous on the free tier, serious when you need a saved, defendable output.
Drive, bike and walk zones from 5 to 60 minutes where routing coverage is available.
Explore the generatorDraw, edit and manage custom polygons for service areas and exclusion zones.
Union, subtract and intersect zones to build exactly the catchment you mean.
Area and perimeter recompute instantly as you draw, edit and combine.
Analyze a catchmentWorldPop population for 2020 or 2030, plus a separate accessibility surface.
Calculate population in a radiusPercentiles, age structure and GDP per capita for any zone you select.
Explore site selectionGeoJSON and PNG for free; branded PDF Decision Packs coming soon, for when it has to convince.
Every zone lives in the link — save your work or hand it straight to a colleague.
Students, researchers, journalists and the simply curious get the full analysis engine at no cost. You only pay when you need a saved, defendable output for a client, a team or a board.
Built on open data — OpenStreetMap, OpenRouteService, MapLibre, WorldPop and MapTiler — with every source credited in the app.
The sky is free to look at. The pack is what you take away — sunrise on the left, open sea on the right, the horizon line between them.
Open the map, drop a pin, and watch the catchment appear. When it has to convince someone, turn it into a Decision Pack — coming soon.