Accuracy depends on the question
A drive-time map is not accurate or inaccurate in isolation. It is a model built for a purpose. A 20-minute catchment can be useful for comparing two candidate sites even when it cannot predict a specific Tuesday commute to the minute.
Define the decision and the required tolerance first. Strategic screening usually needs stable relative differences. Scheduling, emergency response or a contractual delivery promise requires much stronger time-specific evidence than a typical-speed isochrone can provide.
What Horizon Mapper calculates
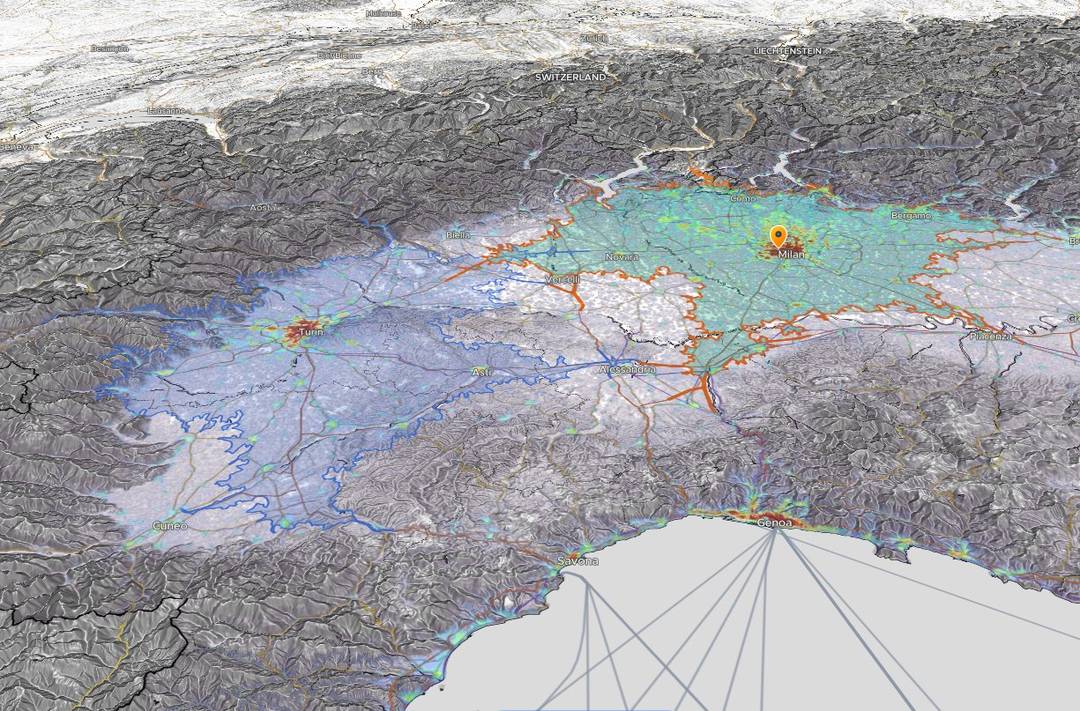
Horizon Mapper asks OpenRouteService for an isochrone around the selected origin. OpenRouteService routes over mapped OpenStreetMap networks and returns a polygon for the chosen driving, walking or cycling duration. The boundary reflects available topology, restrictions and the selected profile.
The result uses typical routing assumptions. Horizon Mapper does not currently incorporate live traffic, temporary road closures or a promise about a specific departure time. The output should therefore be called a modeled drive-time catchment, not a live arrival forecast.
The four biggest sources of difference
Most surprising results can be investigated through four checks: the mapped network, the routing profile, the origin and the timing assumption. A bridge that is missing from the source network can make an area look unreachable. A pin placed inside a large parcel may connect to a different access road than the entrance used by customers.
- Network completeness and freshness: roads, paths, crossings, one-way rules and restrictions.
- Profile choice: driving, walking and cycling are not interchangeable.
- Origin placement: use the real entrance or access point where it matters.
- Time conditions: typical speeds cannot reproduce every peak, incident or seasonal pattern.
Validate before the map carries money or risk
Start by comparing several durations and, when relevant, nearby entrance points. Inspect obvious network features such as bridges, motorways, ferries and border crossings. If a strange notch or island drives the conclusion, check the underlying route rather than accepting the polygon at face value.
For a material investment, compare the modeled result with observed or operational travel evidence: known journeys, customer delivery records, fleet data, local traffic studies or a small field sample. The point is not to force the model to match every trip; it is to learn whether its assumptions could reverse the decision.
Report a range, not false precision
A defensible presentation can show 15-, 20- and 25-minute scenarios instead of treating one boundary as exact. If the same candidate remains strong across those bands, the recommendation is more robust. If reachable population or competitor exposure changes sharply, show that sensitivity explicitly.
Use the methodology note beside the map: routing source, travel profile, duration, origin and the absence of live traffic. Those details make the result easier to challenge and improve.