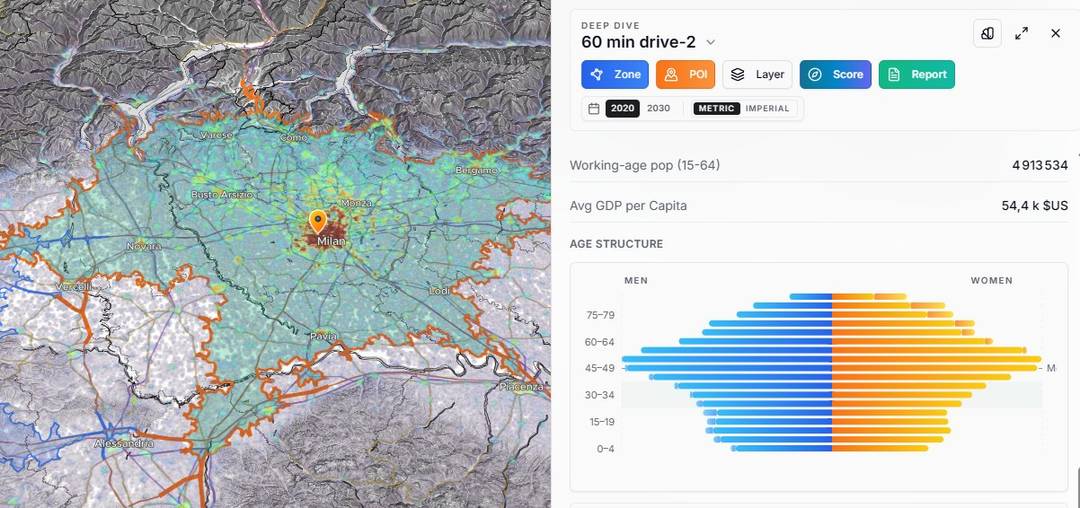
The source is a population surface
Horizon Mapper does not count people directly inside a shape. It reads gridded population sources derived from WorldPop products. Each raster cell stores a modeled value for a particular year and geographic resolution. Demographic bands are delivered through compatible derived rasters where those inputs are available.
That distinction matters. The output is a spatial estimate designed for comparison and planning, not an official address register or a real-time headcount. The page and report should keep the source year and attribution visible.
The polygon becomes a raster mask
The selected zone supplies a Polygon or MultiPolygon geometry. The service identifies the raster window around it, evaluates cell-center locations against the geometry and builds a mask of matching cells. Valid population values in that mask are then aggregated.
At the boundary, a grid cell is not divided into a perfect miniature census block. A cell center can fall inside or outside even when the polygon cuts through part of the cell. This is why a narrow strip or very small polygon is more sensitive to grid resolution than a large catchment.
Preview and exact describe the computation path
Reading every native raster cell can be expensive for a very large area. Horizon Mapper can select an overview for an adaptive preview and records whether the result used the native source or a coarser overview. When an overview is used, its values are scaled consistently with the source representation.
An exact request means the native raster path was used for that computation. It does not mean the underlying population model is exact in the everyday sense. Source resolution, source-year uncertainty and boundary effects still remain.
- Preview: optimized for a responsive first result over larger raster windows.
- Exact: computed from the native raster representation available to the service.
- Both: estimates derived from the same underlying population methodology and selected geometry.
Age structure and economic context load separately
A total-population summary and a demographic profile are not always the same request. Horizon Mapper can load age and sex bands from derived demographic COGs after the first summary. GDP-per-capita context is calculated by sampling the economic surface at population-cell locations, which makes the average population-weighted rather than a simple average of map pixels.
Availability varies by country, year and derived source. A missing band should remain missing or explicitly supplemented from a compatible source; it should not be silently invented.
How to interpret the result responsibly
Use the estimate to compare plausible alternatives at a scale supported by the grid. Check whether a recommendation survives a slightly different boundary, especially near coastlines, borders or dense edges. When a small number of boundary cells drive the result, present that sensitivity.
For decisions that require an official population count, compare the modeled catchment estimate with authoritative administrative statistics where they exist. The two answer different questions: official tables describe fixed reporting areas, while Horizon Mapper estimates the population inside a custom operational boundary.